
Hallway Medicine: It Can Be Fixed
The brief below is part of a cross province campaign begun before the summer election by the Ontario Council of Hospital Unions / CUPE to alert the public to the dangers to hospital and healthcare posed by a Doug Ford Progressive Conservative government. After the election, TD released a reportsuggesting the government to make even deeper cuts to real program spending – $23.9-billion annually by 2022/23. CUPE, along with other unions, is working closely with the Ontario Health Coalition (OHC) and the hundreds of community groups affiliated to it. The OHC Assembly in November debated a new Action Plan, which calls on the community – labour alliance to build a rally at Queen’s Park in the spring that will double the size of the October 24 healthcare rally of 8,000 at the legislature.
Ontario faces unprecedented challenges of hospital underfunding and lack of capacity. For decades governments have pretended to try to address this problem through improved home care. Yet, today the result has been an overwhelmed home care system that has seen a staggering increase in the sickness of the patients it is trying to treat, and a hospital system reduced to treating over-capacity patients in hallways. Funding improvements are needed in all these sectors. The new government has promised to end hallway medicine, yet their fiscal plans threaten to make the situation worse.
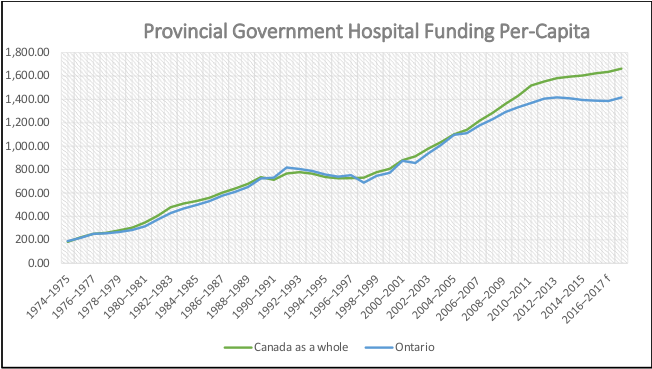
Hospitals typically benchmark against each other to determine care levels and efficiency. But when Ontario hospitals are benchmarked against hospitals in other provinces, a pattern clearly emerges – underfunding and under-capacity. Provincial hospital funding per-capita is 28.3% higher in the rest of Canada than in Ontario – $404.09 more per person per year.
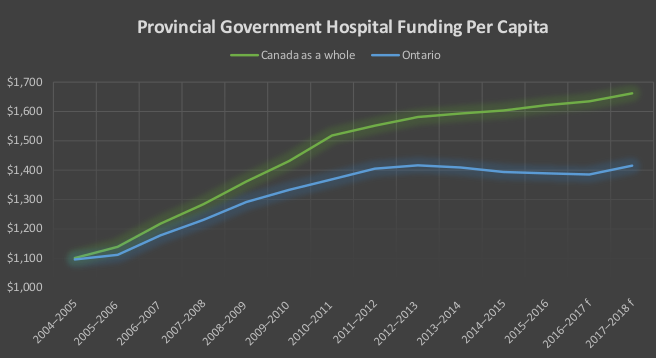
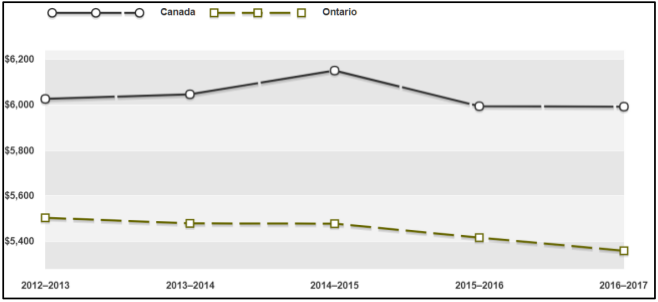
The gap between Ontario and the rest of Canada is a relatively new phenomenon. For decades we were in lock-step with the rest of Canada. We have fallen far behind since 2006.
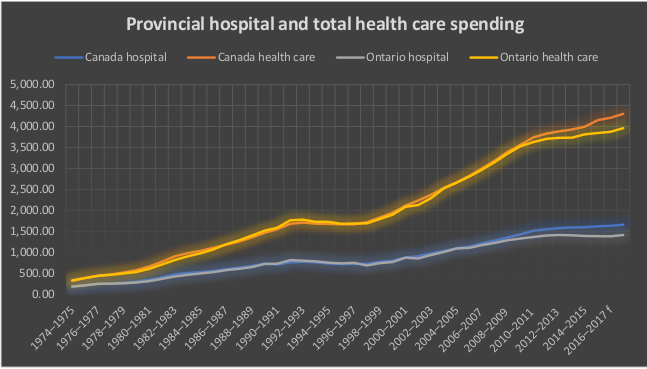
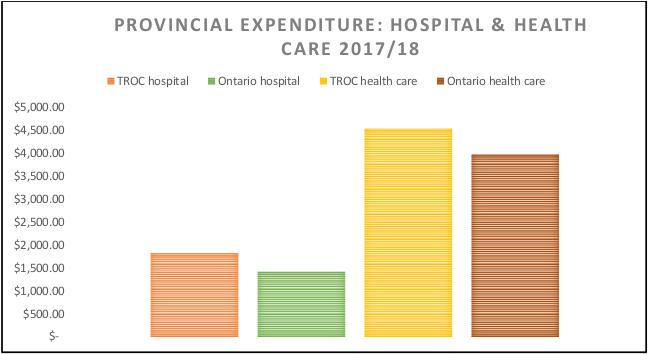
Provincial healthcare funding as a whole is 14% higher per person in the rest of Canada compared to Ontario. That amounts to $561.08 higher per person, per year. The gap in overall healthcare funding between Ontario and the rest of Canada developed at the same time as the gap for hospital funding developed. Hospital underfunding accounts for almost three-quarters of healthcare underfunding.
| Canada | Canada excluding Ontario | Ontario | ||||
|---|---|---|---|---|---|---|
| Hospital | Healthcare | Hospital | Healthcare | Hospital | Healthcare | |
| 2017-2018 f (millions) | 61,337.7 | 158,758.9 | 41,214.0 | 102,466.0 | 20,123.7 | 56,292.9 |
| Population 2017 (000) | 36,642.1 | 22,525.70 | 14,116.4 | |||
| Per Capita | $1,673.97 | $4,332.69 | $1,829.64 | $4,548.85 | $1,425.55 | $3,987.77 |
| Source: CIHI National Health Expenditure Trends, Data Tables | ||||||
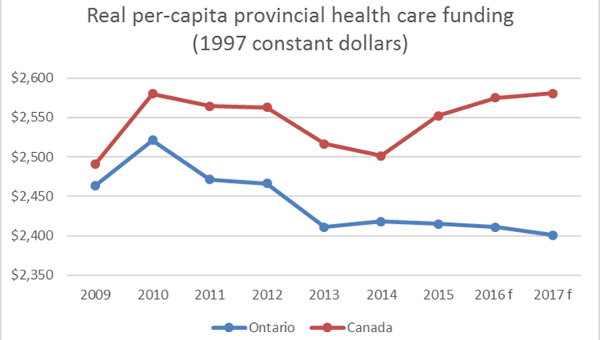
In fact, Ontario provides the least healthcare funding per person of any province. Below is a chart with the provincial government per person dollar funding since 2008 in real dollars (using constant 1997 dollars). In 2017, real funding per person was still less than in 2008 – although the Ontario economy was about 17% larger than it was in 2008 in real terms. The hysteria about the runaway healthcare cost is just that – hysteria.
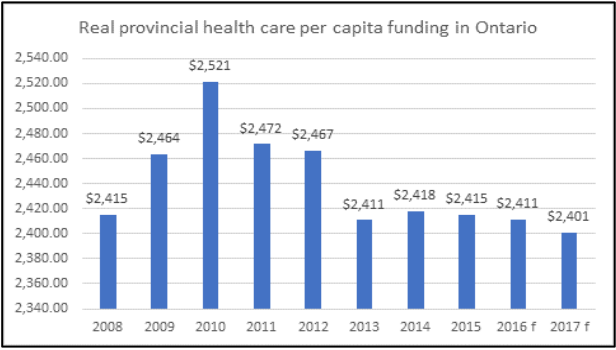
Two-thirds of this dollar cut came from cuts to hospital funding. Between 2010/11 and 2017/18 real provincial hospital expenditures were cut 8.3%.
That is a cut of $81 per person per year in constant 1997 dollars since 2010, or $128 per person in today’s money.
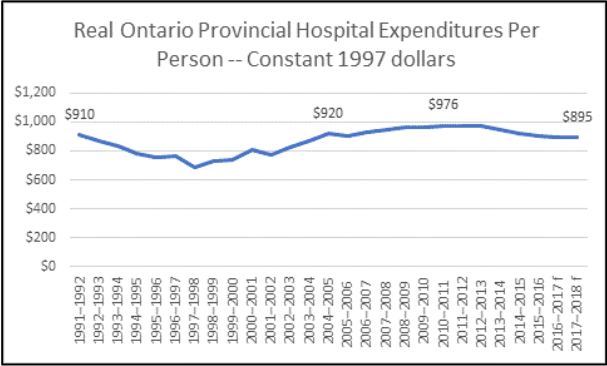
In fact, real provincial expenditures on hospitals are lower than they were in 1991 – despite very significant economic growth per-capita, an increase in the median age in Ontario from 33.3 years to 40.6 years, and a doubling of the population over 65 (with even bigger increases in the population over 85).
Hospital Costs per Patient Also Going Down
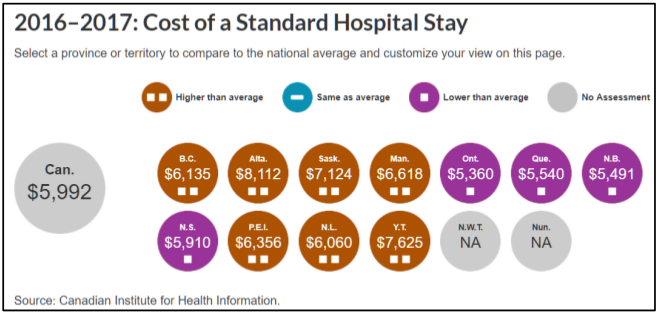
In the four years from 2012/13 to 2016/17, standardized costs for a hospital stay (adjusted for differences in the types of patients) have fallen 2.6% in Ontario. Ontario has the lowest cost for a standardized hospital stay of any province.
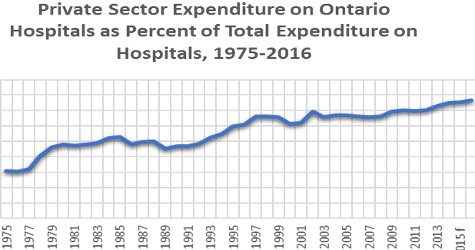
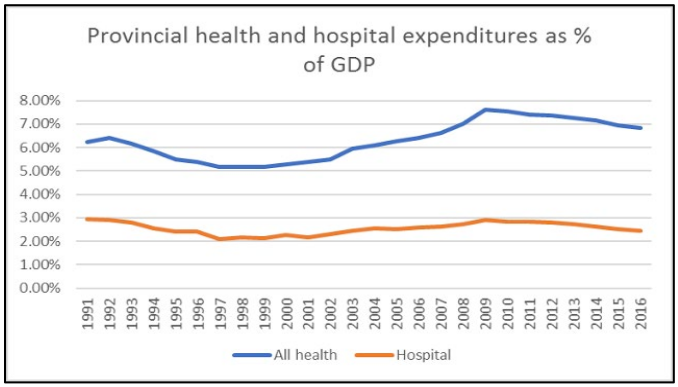
Ontario hospital expenditures are a lower share of the economy than 25 years ago: Ontario provincial government hospital expenditure as a share of the economy has declined – not just since 2009, but since 1991.
Ontario has been through a period of healthcare austerity since the 2008 recession – ten years. There are signs that the public believes it has put up with enough cuts. Another period of cuts is not likely to be received well by the population.
Hallway Medicine
| Population | (000) |
|---|---|
| Canada | 36,642.10 |
| Ex. QC and Ont. | 14,142.90 |
| Ontario | 14,116.40 |
| Hospital Beds | |
| Canada ex. QC and Ont. | 39,420 |
| Ontario | 30,896 |
| Beds per thousand pop | |
| Canada ex. QC and Ont. | 2.79 |
| Ontario | 2.19 |
| Source for bed numbers: CIHI, Hospital Beds Staffed and in operation 2016-17. Data as of Jan. 24 2018. Quebec data not reported by CIHI. | |
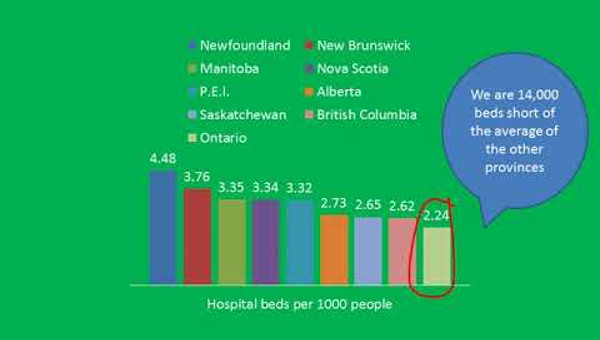
A key result of hospital funding is that Ontario has fewer beds than the rest of Canada and far fewer beds than other developed countries. The rest of Canada has 27.4% more beds per capita than Ontario (i.e. a difference very similar to the funding difference with the rest of Canada).
If Ontario had the same beds per capita as in the rest of Canada, we would have 39,385 beds. That is an 8,489 extra beds.1
What Does This Mean for Ontario?
Bed occupancy is very high in Ontario as a result of the lack of staffed and operating hospital beds. Bed occupancy in hospitals should not exceed 80-85%. High levels of bed occupancy drive emergency room delays, superbug infections, cancelled surgeries, delays and backlogs. In developed countries bed occupancy rates hover around 75%.
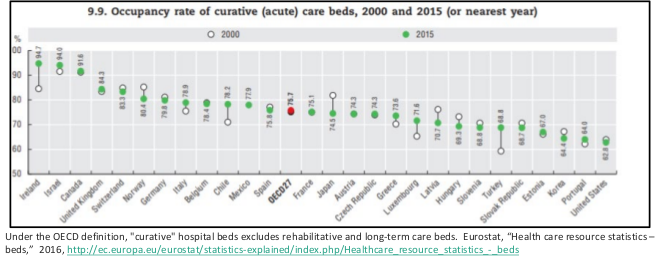
Ontario, however, often has hospitals with bed occupancy over 90% in all sorts of hospital beds – chronic care, rehabilitation, acute care, mental healthcare. It is not especially unusual for larger urban centres to have occupancy over 100%, and sometimes far over 100%.
Removing patients from hospitals: Ontario hospitals have the lowest age-standardized length of stay of any province, 11.4% less than the Canada-wide average. In fact, Ontario is significantly lower than any other province in terms of length of stay.
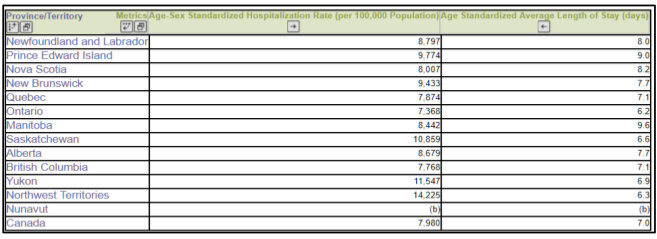
Difficult to access inpatient services: Despite this short length of stay, it is also harder to be admitted to a hospital in Ontario than anywhere else in Canada – with Ontario having 7.7% fewer (age and sex standardized) hospital admissions than Canada as a whole. Again, no other province even comes close to the low number of hospitalizations as Ontario. Both of these factors are of course in accord with the low number of beds in operation in Ontario. Not surprisingly, hospital readmissions in Ontario have also crept up.
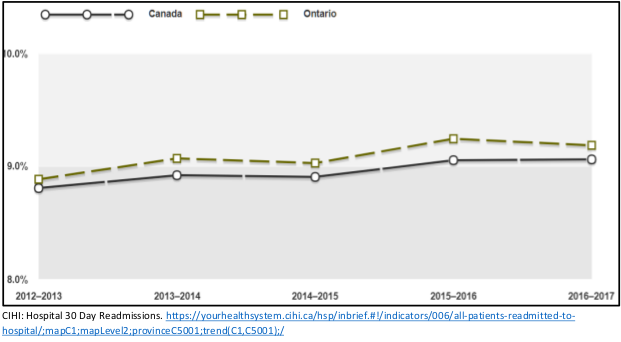
The increase over four years from 8.9 readmissions per 100 patients to 9.2 is a 3.4% increase.
Long-Term Care (LTC) Bed Faltering Supply: Between 2010 and 2016, long-term care beds grew in total by 1.5% according to Ontario provincial Budget documents. That is less than 1⁄4 of one percent per year. This is slightly slower than over the 2004-2005 to 2011-2012 period. The Auditor General reported in 2012 that the number of long-term care beds in Ontario grew only 3% over that seven-year period. That is an annual average growth rate of 0.42% for that period. The 85 and older population has grown roughly twenty times quicker than the number of new LTC beds.
Restricting LTC access to only the sickest: With few new beds, wait lists grew rapidly. The government’s response to this was to restrict access to the wait list. Only the sickest are even being allowed to wait for a LTC bed. Even so, 26,500 people were on the wait list in 2017 for LTC, an increase from 24,500 in June 2015 and occupancy is at very high levels. The lack of new capacity means that LTC residents that are getting into the home are much sicker.
Sicker LTC residents require more care: LTC residents now have a much higher acuity and require much more care. Residents with heart disease are growing at a rate of 4.5% per year, those with renal failure are growing at a rate of 3.7% per year. Residents with six or more formal diagnoses are growing at a rate of 4.8% per year. From the last quarter of 2009 until the first quarter of 2015, new admissions with high or very high MAPLe scores increased from 75.9% to 85.3%. New admissions with very high MAPLe scores are growing particularly quickly. Growth in care that is labour intensive is growing at an alarming annual rate: 5.2% for oxygen therapy, 9.7% for the administration of IV medications, 8.3% for the monitoring on input and output.
Home Care Acuity Way Up: The restrictions placed on LTC beds and hospital care has also dramatically driven up the acuity of home care patients overseen by Community Care Access Centres (CCACs – now merged into Local Health Integration Networks or LHINs). In just five years, the percentage of patients with CCACs who have higher care needs increased from 37% to 68% and lower need patients declining from 63% to 32%. The province is moving to remove low need patients from the LHIN home care altogether. For almost three decades governments have advocated reducing hospital capacity through increased home care. While increased home care is desperately required, it cannot in this situation replace hospital care. That excuse can no longer stand.
Tens of thousands of new LTC beds needed just to offset aging: An additional thirty thousand LTC beds by 2028 will only partially offset the rapid growth in the 85+ population. The ministry of finance projects 42.5% growth in the most relevant population (85 and over) between 2018 and 2028. That growth would require an additional 33,300 LTC beds.2 In other words 30,000 new beds will not entirely offset aging and would require either more patients to be treated in home care or hospital. It will definitely not solve the hospital capacity problem. Indeed, it will not make up for any portion of the decline in LTC capacity between 2004 and 2018 noted above. By itself, it will not even reduce the LTC wait list.3
Aging, Population, and Inflation: Changing Demographics and Hospital Cost Pressures
Population growth and aging are two widely accepted drivers of the need for more healthcare. Ontario is aging. Median age was 29.2 years in 1978. It is now 40.6 years, the same as the rest of Canada. The number of seniors in Ontario aged 65 and over is projected to almost double from 2.3 million, or 16.4 per cent of population, in 2016 to 4.6 million, or 25.0 per cent, by 2041. The growth in the share and number of seniors accelerates over the 2016–2031 period as baby boomers turn age 65. The annual growth rate of the senior age group is projected to be 3.6 per cent annually over 2016–2031.
Importantly, the oldest age groups will experience the fastest growth among seniors. The number of people aged 75 and over is projected to rise from 1.0 million in 2016 to 2.7 million by 2041. The 90+ group will almost quadruple in size, from 115,000 to 400,000.
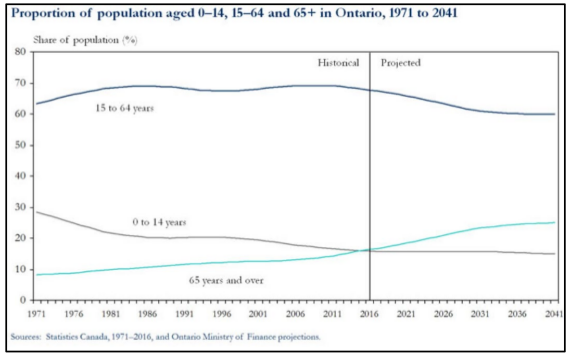
Ontario’s population is projected to grow by 30.3 per cent, or more than 4.2 million, over the next 25 years, from an estimated 14.0 million on July 1, 2016 to more than 18.2 million by July 1, 2041. The annual rate of growth of Ontario’s population is projected to ease gradually from 1.8 per cent annually to 0.8 per cent over the projection period. By 2041, there will be more people in every age group in Ontario compared to 2016, with a very sharp increase in the number of seniors. Given these realities, hospital capacity must not be reduced.
Ontario may not be able to immediately return to a level of service in other provinces given the large gap that exists. But we should keep up with cost pressures. With aging, population growth, hospital inflation, and increasing utilization, hospital cost pressure are 5.2%. This allows 1% increase for aging, 1% for population growth, 2.2% for inflation4 and 1% for increased utilization.
Typically, increased healthcare utilization is connected with growing wealth of a society. People in richer societies tend to use more healthcare – a rational choice given the preeminent value of health. However, in Ontario’s case, any increased hospital bed utilization would, at best, begin to move us away from outlier status and begin to return us to the hospital bed average. It would however take many years to achieve that goal with increased utilization at only 1% per annum and only if comparator jurisdictions saw little or noincreased hospital bed utilization.
What Might a Progressive Conservative Government do to Hospitals?
The Progressive Conservatives (PCs) talked during the election of finding 4% savings. It is difficult, given the vagueness of the comments, to know how this will affect various public services. It is clear that will be difficult to exempt hospitals from such a cut given that hospital services are by far the largest single area of program spending (1/7th of total program spending).5
How might this affect hospitals? Given the concern expressed about ‘hallway medicine’ by the PCs and others during the election, one key area to examine would be the potential impact on the operation of hospital beds.
One method of proceeding would be to assume the 4% cut will be applied evenly to hospital services, neither more nor less than other areas.6 As provincial government funding compromises about 85% of hospital revenue, the reduction in beds would, on this basis, be slightly less than 4% – about 3.4% (4 x 85%). Across Ontario, that would mean a reduction of 1,050 beds (30,896 existing x 3.4%).
However, ultimately, the PC program appears to threaten larger cuts. First, it appears unlikely that the PCs are starting from the increases funded in the last Budget – a Budget which proposed a significant hospital funding increase (4.64%). Notably, this included continuing the 1,200 flu season hospital beds and 217 reactivation, ventilation and mental health hospital beds established in the fall of 2017.
Second, the PCs have also promised to balance the Budget despite [A] promising well over $7-billion in annual tax cuts, and [B] all but endorsing an accounting methodology advanced by the Auditor General which will add $6-billion to the deficit by 2020/21.
That would make a deficit in the $13-billion a year range by 2020/21 – meaning that a balanced budget would require a cut of about 8.74% of program spending. Applied evenly to hospital services, that would be a 2,295 bed cut across Ontario (30,896 x 8.74% x 85%). With the threatened loss of the 1,417 seasonal, reactivation, ventilation, and mental health beds funded in the 2018 Budget, the total loss could be 3,712 hospital beds.
Staff Cuts
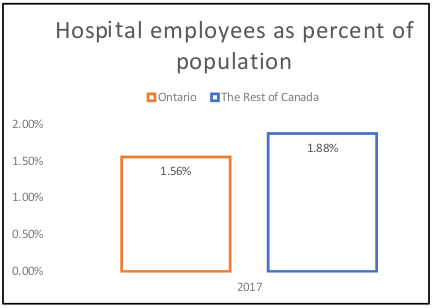
The Progressive Conservative government has promised that its 4% cut will not lead to layoffs. But to date there is no promise to stop cuts to hospital jobs. With at least 4% turn-over per year, the elimination of would vacant soon positions deepen the crisis in hospitals – especially as hospitals across the rest of Canada are already staffed 21% more than in Ontario.
A 4% cut in funding for Ontario hospitals would amount to 8,560 jobs cut from the hospitals,7 while an 8.74% cut would amount to 16,418 jobs (221,000 x 8.74% x 85%). A lot is at stake. Notably, the hospital C. Difficile rate is the highest in central Canada (Quebec and Ontario), where hospital funding is lowest.
Privatization and Restructuring
Two possible responses to the funding crunch created by PC revenue cuts are particularly risible: privatization and restructuring. Privatization constantly bedevilled the previous Liberal government. Private physiotherapy clinics had to be defunded after the health minister revealed that the “existing 94 clinics have had an unlimited ability to bill the government and have become very creative in the way they bill.”
P3 problems: An initial report by the Auditor General showed that the first privatized “public private partnership” (P3) hospital (the Brampton Civic) came with hundreds of millions of dollars of extra costs. That was ignored by the government and so the next Auditor General reviewed the next batch of P3 hospital projects and showed that the next P3 hospitals came in $8-billion over the cost of a public sector comparator.
Even more healthcare privatization problems: Private plasma clinics openly defied the government, the Ontario Health Coalition revealed that extra-billing is a widespread practice at private clinics, ORNGE air ambulance used privatization to hide exorbitant executive salaries, a patient died as private surgical clinics escaped proper public regulation, and a contracting-out scandal sank eHealth, forcing the resignation of the Liberal health minister, the eHealth chair, and the eHealth CEO.
The Restructuring “Solution”: The PC government may also look to merge and close hospitals. This was a key strategy adopted by the previous PC government of Mike Harris. It merged or closed dozens of hospitals as part of that government’s attempt to cut hospitals. The Auditor General revealed however that the mergers and hospital restructuring actually cost the province $3.2-billion dollars. Despite hopes that these mergers would help them cut spending, the Harris government quietly recognised reality, starting in 1998. By 2000, they quietly completed a U-turn on hospital funding, increasing funding 12.6% in one year.
| Provincial Hospital Funding Annual Percentage Increase (or Decrease) | |
|---|---|
| 1995 | -1.5 |
| 1996 | 1.9 |
| 1997 | -4.8 |
| 1998 | 5.2 |
| 1999 | 6.1 |
| 2000 | 12.6 |
| 2001 | 3.1 |
| 2002 | 8.4 |
| 2003 | 9.7 |
| 2004 | 9.6 |
| Source: CIHI National Health Expenditure Trends, Table D.4.6.1 | |
Between 1998 and 2003 (when the PC government was defeated), funding increased on average 7.5% per year. The Health Services Restructuring Commission completed its work and shut down in March 2000. So arguably the fruits of its work might be expected to have been gained in the five following years (including the first full year of Liberal governance). But funding increases averaged 8.7% for the 2000-2004 period. This, needless to say, is not strong evidence that the mergers, closures and restructuring did anything to reduce costs.
Conclusion
Ontario healthcare and hospital funding is far below the level in other provinces. Since 2009, cuts to real hospital funding have been particularly harsh. Ontario is an outlier in terms of the provision of hospital inpatient services. We have very few hospital beds and as a result, very high bed occupancy. Returning Ontario hospitals to levels found in other provinces would result in a very big increase in capacity. Returning to levels in other developed countries would lead to a huge increase in capacity. The Ontario government’s plan to reduce government revenue, while eliminating the deficit (and possibly adopting a new accounting method), will require major cuts that could seriously undermine public services. Ontario hospitals have already been cut to the bone – further cuts will have serious consequences.
In early October, the new Progressive Conservative government announced 640 flu season beds and “spaces”. Troublingly, this is significantly less than the 1,200 flu season beds announced last fall by the previous government. It is not yet clear which hospitals will receive flu season funding and beds this year – and which will not – nor how this could resolve the expected increase in demand associated with the flu season. It is also not clear how this fits with Christine Elliott’s promise to the legislature that “[w]e are not cutting hospital beds. We want to increase the beds that are available for people. We want to increase the services that people can receive.”
Instead of more cuts, Ontario needs a multi-faceted approach to the crisis in care, aging and population growth that will increase capacity in LTC, home care, and hospital care.
- Hospitals need to be funded at their real costs, 5.2% annually, otherwise we lose capacity in a system already an outlier in terms of fewest beds and staff to population.
- We need to open hospital beds to meet the challenge of an aging population. We need, at the very least to increase our bed numbers to meet the average of other provinces – i.e. another 8,400 beds.
- Home care and Long-term Care funding needs to be increased to recognize the acuity of the patient population, as thousands of patients with complex medical conditions have already been deposited there from the hospital system. We need legislation guaranteeing a minimum average of 4 hours of direct nursing and personal care per resident per day in Long-term Care.
- We need to increase home care capacity and we need over thirty thousand public Long-term Care beds just to offset aging. This will not offset growing need for hospital or home care services. It will not even make up for the loss in LTC capacity over the last 14 years.
- Mental Health and addictions has long been neglected and need a substantial investment to meet current needs.
- Restructuring of hospitals has proven to be hugely expensive and is unaffordable and ineffective.
- Privatization of infrastructure and services has proven to be inefficient and unaffordable. •
Resources:
- Ontario Council of Hospital Unions/CUPE
- Ontario Health Coalition
- OCHU Strategic objectives in 2018-2019
- The PDF version can be downloaded here.
Endnotes
- The rich country with the least number of hospital beds, Sweden, has 2.4 beds per thousand – if even that was applied to Ontario that would mean an extra 3,000 beds Some advocates of hospital cuts have focused on Denmark, the only other developed country with fewer hospital beds than Canada. But it has 2.5 beds per thousand – that would mean an additional 3,400 hospital beds in Ontario. Ontario is truly an outlier.
- This may underestimate the number of beds required as in recent years the government has begun to move young people into LTC homes. If this policy is deepened, the number of beds required would increase further. Another factor that will likely increase LTC demand further is that the oldest age group (90+) is growing at an even more rapid rate than the 85+ age group. The 90+ age group will be 48.2% bigger by 2028. If that age group drives growth, 37,875 new beds would be required.
- The Conference Board estimates 78% growth in the need for LTC beds in Canada between 2017 and 2035 – even while assuming a marked reduction in the percentage of elderly people in LTC and increased number of patients dealt with through home care. Applied to Ontario this would mean an additional 60,800 LTC beds.
- This is the ten-year Ontario average for the government current expenditure implicit price index, the inflation index used by CIHI to estimate real healthcare funding.
- With healthcare as a whole accounting for approximately 40% of program spending, it will likely be impossible to avoid targeting it. If it is not targeted, funding cuts for all other sectors would have to equal 6.7%.
- Notably, the trend in recent years has been to reduce inpatient care rather than outpatient or community care, so this may be an optimistic assumption.
- 221,000 current jobs x 4% (cut in government funding) x 85% (government share of total hospital funding).