Second Wave Vs. First Wave: What Has Changed?
Posted: November 23, 2020
(November 23, 2020)
Current Situation
At the time of writing this submission (November 17) there are 100 active outbreaks in Ontario’s long-term care homes, up from 76 as at October 31.[1] There is no clearly defined date as to when we can measure the start of the second wave, but throughout the summer months, though outbreaks still began, there was only one that had more than five cases.[2] As of September 1 there were 18 ongoing long-term care outbreaks.[3] The outbreak at Extendicare’s West End Villa was declared on August 30 with one positive case and the numbers expanded from there. Within a few weeks there were eleven long-term care homes in Ottawa with outbreaks and the outbreaks began to spread beyond a few positive cases. Thus, the beginning of September can be described fairly, we believe, as the beginning of the second wave. After September 1 and particularly after schools reopened, case numbers in long-term care began to rise. Over the last two-and-a-half months both the number of the outbreaks and the severity of the outbreaks has increased dramatically.
Of the current Ontario long-term care home outbreaks:
• 34 outbreaks include more than 10 residents and staff infected;
• 13 outbreaks include more than 50 residents and staff infected;
• 12 outbreaks include more than 99 residents and staff infected
• 4 outbreaks include more than 150 residents and staff infected.[4]
According to the province’s epidemiological data for the single day of November 17, there were 700 currently active confirmed cases among long-term care residents and 524 currently active confirmed cases among long-term care staff.[5] By comparison, at the end of August there were there were 3 currently active cases among long-term care residents and 18 currently active cases among long-term care staff.6
Looking at the cumulative cases for the second wave to date we can see the sharp escalation in recent weeks:
• The total of long-term care COVID-positive cases from September 1 – November 10 was 1,919 (1,536 residents, 386 staff).
• The total of long-term care COVID positive cases from September 1 November 17 was 2,424 (1,920 residents, 504 staff).
Thus, in the most recent single week, there has been an increase of 505 cases in Ontario’s long-term care homes according to Public Health Ontario’s data.
The Centre for Disease Control in the United States[7] and epidemiologists in Canada[8] have warned that increases in cases among younger people spread to older age groups with a time lag of several weeks. That is what appears to have happened in the second wave in Ontario. The significant increase in case numbers in schools and among youth and young adults at the beginning of September was followed by an increase in test positivity rates among middle aged and then elderly people. Our tracking found a significant increase in case numbers in schools in October. While the numbers of COVID-19 cases among the general population increased by 24 percent in the last two weeks of October, the spread in case numbers in schools increased by 67.7 percent. The other sectors that showed increases above the general population were retail and public services.[9] If the case numbers follow the trends identified by the CDC and Canadian epidemiologists, the very significant increase among young people bodes ill for the numbers in the 40-plus (and thus the 70-plus) age groups. Current Ontario Public Health epidemiologic data shows that sixty-four percent of COVID-19 deaths currently are in long-term care[10] and 27 percent of those aged 80 and over who contract COVID-19 die.[11] As test positivity rates increase among the population in younger age groups, every day lost in establishing effective interventions to stunt the spread of COVID-19 in long-term care risks more suffering and death.
Changes from Wave I
Public Health Ontario was not tracking long-term care outbreaks at the beginning of the first wave of the pandemic. As a result, we began tracking outbreaks and case numbers using local Public Health Unit outbreak reports and following all case numbers in every long-term care home, retirement home and hospital as they were reported by each local Public Health Unit.[12] Throughout the pandemic we have continued to issue reports as frequently as we have the resources to do so, tracking the spread of COVID-19 in long-term care homes and other settings. To find the numbers, we have tracked the outbreak reporting for each outbreak from each local Public Health Unit from beginning to end of outbreak. There are significant differences in the data provided by local Public Health Units and Public Health Ontario’s data. In response to questions about the inaccuracies in Public Health Ontario’s data, and reported problems with their database, the epidemiologic reports began to include numbers from the Ontario Ministry of Long-Term Care database which they contend includes reporting to the Ministry directly from long-term care homes. The data is significantly different between these two central databases and both at times have had significant differences from our tracking, based on local Public Health Units’ data.
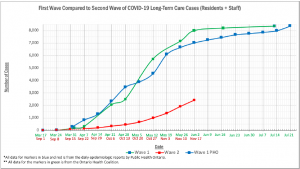
Using the data from Public Health Ontario and our own data from the first wave, and comparing it to the data reported from Public Health Ontario in the second wave, we can see the trajectory of the first and second waves to date in the chart below.
Notably, the second wave started more slowly than the first wave but in the last three weeks (since October 27) the spread of COVID-19 in long-term care has escalated in an alarming way.
In the first wave, the most significant and devastating growth in the numbers of staff and residents infected with COVID-19 happened between mid-April and mid-May. In the second wave, the increase in the number of COVID-positive residents and staff was steady but relatively slow through September. In October, the spread of the virus began to pick up. From October 27 on the spread has increased dramatically.
From October 27 to November 17, the number of residents and staff who have tested positive for COVID-19 in long-term care homes has escalated by approximately 1,500 in three weeks. In the first wave, we saw this scale of growth in the 2 1/2 weeks from March 31 to the third week of April; in the two weeks from April 21 to May 5 followed by a very sharp escalation of approximately 2,000 positive cases in the two weeks from May 5 to May 19; and then a return to a slower increase of approximately 1,500 over the 4-week period from May 19 to June 16. The bottom line is that the numbers over the last three weeks are now tracking similarly to the numbers leading into the period of the highest growth in the first wave. The current rate of transmission reported is just slightly below that of the two periods of the second highest growth rate in the first wave and it is escalating. The very high rates of transmission in the general community among younger age groups in October bode ill for the spread into long-term care homes in the coming weeks. Once the virus enters the homes as a result of that community spread, stronger measures in the homes need to be in place quickly to reduce the alarming rates of transmission that we are now seeing.