REPORT: Tracking of COVID-19 Outbreaks in Health Care Settings – Data Updated to October 28
Posted: November 3, 2020
(November 3, 2020)
————–
Introduction
Each number included in this tracking data represents a human being who is loved and who has experienced the terrible toll of COVID-19: staff who have gone to work despite the risk and the fear; residents and patients who have contracted COVID-19; families and communities who have lost their loved ones; staff who have made the ultimate sacrifice. You are in our hearts. To the media, the Public Health and Ministry staff who have been tracking and compiling this information for public scrutiny, thank you for your work. To all of you, we give our commitment to advocate to the best of our ability and to do everything we can do for the best protection and care for all affected.
This report is the result of many hours of work by our staff and volunteers. A special thank you is due to the following volunteers who have gone above and beyond to help track the spread of COVID-19 in health care settings in their communities:
Shahrdad Aliakbari, Nick Alpin, Saatvik Anand, Rose Anderson, Roy Brady, Necia Brown, Elyse Chaikalis, Hilary Cheung, Yenning Chua, Rolf Gerstenberger, Matthew Gventer, Sue Hotte, Xiaohan (Erica) Hou, Victoria Hoszka, Meghna Katyal, Dot Klein, Joleen Lam, Claire Lownie, Rachel Makkappallil, Alma Martin, Mary Catherine McCarthy, Magee McGuire, Salena Nemariam, Zaid Noorsumar, Fernanda Ortega, Ashwini Patel, Veda Popal, Sabrina Quartarone, Tracey Ramsey, Zoya Retiwalla, Shirley Roebuck, Mervyn Russell, Stuart Ryan, Samrin Sobahan, Bryan J. Smith, Jim Stewart, Jules Tupker, Veronica Zhu
A special and heartfelt thank you also to Megan Lee, Riley Sanders and Salah Shadir, our intrepid and talented staff who have worked day and night to research, fact check and distribute these tracking report updates throughout the pandemic.
We are deeply grateful and we simply could not have continued to do this work without all of you. Thank you.
Natalie Mehra, Executive Director
Summary & Charts
Since the week of March 12, the Ontario Health Coalition has been tracking all people who have been infected in COVID-19 in outbreaks in health care settings including hospitals, long-term care, retirement homes, public health units, clinics and congregate care settings, as well as among other health professionals such as paramedics. This has become a gargantuan task but an important one because it enables us to see more fully than is possible from the government data where the spread in health care is happening and whether infection control measures are working to contain it.
This report covers the period from September 18 to October 28. There are notable changes. The rates of increase by all measures grew substantially over the last 6 weeks. There are many new outbreaks being found daily, and while most are limited to a five or less people, a growing portion of them are horrifyingly large, and comparable to the sizes of the outbreaks in the height of the first wave in early May (50 to 100+ cases in staff/patients/residents cumulatively).
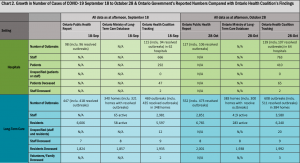
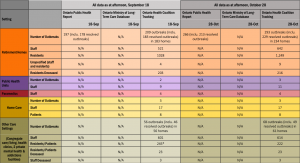
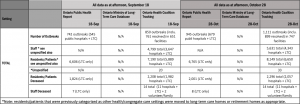
Here are the key findings from the most recent tracking contained in this report of cases in health care settings across Ontario up to the afternoon of October 28:
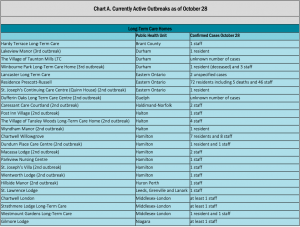
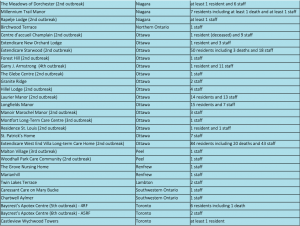
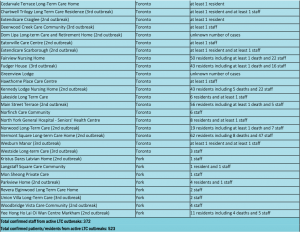
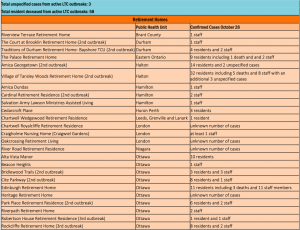
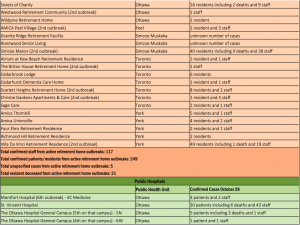
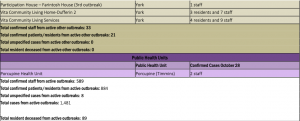
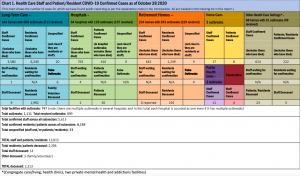
- Totals in this period: As shown in Chart A on page 4, the Ontario Health Coalition found 181 currently active outbreaks in health care settings. Most are new, having started from September 18 to October 28. In the currently active outbreaks there are a total of 589 staff members who have contracted COVID-19 in health and congregate care settings, 884 patients/residents, and 8 unspecified cases for a total of 1,481 cases in active outbreaks as of October 28. We found 89 residents deceased among the active outbreaks in this period.
- Cumulative totals to date: In our research we have found that the cumulative number of people infected by COVID-19 in health and congregate care settings including staff and patients/residents is 13,813 as of October 28, up from 12,009 as of September 18. This total increased by 1,804 people or 13.1 percent in six weeks, more than 3 times the rate of increase the previous four weeks when the increase was 3.8 percent. This data is in Chart 1 on page 12, and Chart 2 on page 13.
- Patients/Residents: The rate of increase in the number of patients/residents that have been infected by COVID-19 in health and congregate care settings has grown. Presented in Chart 1 on page 12, and Chart 2 on page 13, by October 28 we have tracked a cumulative total of 8,149 patients/residents who have contracted COVID-19 in health and congregate care settings. This is an increase of 959 patients/residents in six weeks (since September 18) or 11.8 percent. This growth rate more than four and a half times as what we had calculated between August 25 and September 18 (2.5 percent).
- Staff: The rate of staff that have been infected by COVID-19 in health and congregate care settings is also much higher, as shown in Chart 1 on page 12, and Chart 2 on page 13. By October 28 we have tracked a cumulative total of 5,631 staff members who have contracted COVID-19 in health and congregate care settings. This is an increase of 832 staff in six weeks (September 18) or 14.8 percent. This is more than twice the rate that we calculated between August 25 and September 18 (6.0 percent).
- Deaths: The rate of increase for deaths of patients, residents, and staff in health and congregate care settings has more than doubled. The Ontario Health Coalition is deeply sorry to report that as of October 28, we found a cumulative total of 2,296 patients and residents deceased in outbreaks in health and congregate care settings, up from 2,208 deceased as at September 18. The deaths among staff have not increased in this period. That increase amounts to a heartbreaking 88 residents and patients over six weeks or an increase of 3.8 percent. This greater than what we calculated between August 25 and September 18 (1.5 percent), shown in Chart 1 on page 12, and Chart 2 on page 13.
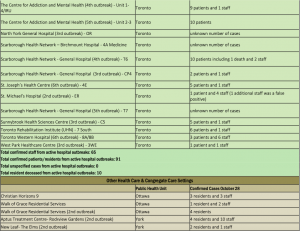
- Currently active outbreaks: There are currently 97 active outbreaks in Ontario long-term care homes that we have found. This is more than double the number of active long-term care home outbreaks we found on September 18 (35 active outbreaks). This is higher than the numbers reported by the Ontario government and Public Health Ontario. We also found 32 active outbreaks in hospitals, and 64 active outbreaks in retirement. A growing percentage of these outbreaks are large (10 or more cases). As of October 28, there were 33 active outbreaks in health care settings that fit that description- 15 in long-term care outbreaks, 10 retirement home outbreaks, 5 hospital outbreaks, and 3 outbreaks from other health and congregate care settings.
- The Ontario government is currently reporting two data sets for health care outbreaks: Public Health Ontario’s data set and the Ontario Ministry of Long-Term Care data set. This can be found on Chart 2 on page 13. Public Health Ontario’s data has been inaccurate throughout, perhaps due to problems with its database. It is transitioning to a new database along with local Public Health Units. While in our last report (to mid-September) we found 29 fewer outbreaks cumulatively to date in long-term care homes than Public Health Ontario; as of October 28, Ontario Public Health reports 56 fewer long-term care outbreaks (552) than we found (608). In our last report on September 18, we had found 22 more outbreaks in long-term care homes. The Ontario Ministry of Long-Term Care has found even fewer long-term care outbreaks than we have, a cumulative total of 383, which is an astonishing 225 fewer. It may be that they are not counting every outbreak a facility has, any longer, and are combining them into one outbreak. We have also found more outbreaks in retirement homes and hospitals than Public Health Ontario. Public Health Ontario found 266 retirement home outbreaks, as compared to our 293, and 127 public hospital outbreaks, as compared to our 139. The details of each outbreak that we have found since the beginning of the pandemic are in the body of our report, each one from a credible source and each one footnoted.
- One of the things the Ontario Ministry of Long-Term Care does not report is the date that the outbreaks are resolved, nor do they report any longer how many COVID-19 outbreaks that facility has had since the beginning of the pandemic. As many facilities are having multiple outbreaks, and sometimes more than one outbreak at the same time, the outbreak status of these health care settings is a little more complex than simply “active” and “resolved”. Out of the 384 long-term care homes that have had outbreaks that we found cumulatively, 161 homes, or 42 percent have had 2,3, or even 4 outbreaks.
- The number of outbreaks that are currently active across health care settings, as in the outbreaks that are ongoing as of October 28 and are not yet resolved (different than the new outbreaks), that the Ontario Health Coalition found is 212 compared to 89 four weeks prior (September 18, though we may not have been able to find all outbreaks as there is less public reporting now than there was in April through to early May). The cumulative number outbreaks in health care and congregate care settings that we found as of September 18 is 1,111 (including 899 resolved) in 747 facilities including hospitals, long-term care homes, retirement homes, Public Health Units, clinics and other congregate care settings. As of September 18, we had found 762 outbreaks (including 669 resolved) in 599 facilities.
Discontinued Data
- On June 10 Public Health Ontario ceased to report the following in the Daily Epidemiologic Report[1]: the total number of health care workers infected; the numbers of confirmed cases by likely source of acquisition (exposure), and; the total number of cases among retirement and hospital outbreaks. June 9 was the last time they included this information in the daily Epidemiologic Summary. [2] They are still reported in the Weekly Epidemiologic Summary. Weekly Summaries began on the week of May 31 to June 6.[3] The following pieces of information have also been taken out of the daily Epidemiologic Summary after June 9 regarding retirement homes and public hospitals, and cannot be found anywhere else: how many cases are reported among staff as opposed to patients/residents; the total number of deaths; deaths among residents/patients, and; and deaths reported among staff members. They have not provided any explanation for discontinuing the reporting of these vital pieces of data.
- The daily total number of health care workers infected can now be found on the Public Health Ontario website[4], rather than Ontario Ministry of Health website[5] where both Public Health Ontario and the Ministry of Long-Term Care had previously been reporting this type of data. It should be noted that both websites have data that is updated business day or every day, respectively. Therefore, it is not possible to view past data, which makes it very difficult to track the course of the pandemic.
- The Ministry of Long-Term Care data has also been changed. For the aggregate numbers, they are now only reporting the currently active cases each day in long-term care homes (see Chart 2) not the cumulative totals of confirmed residents and staff COVID-19 cases in long-term care outbreaks. Again, there is no explanation for discontinuing this reporting.
Note about Methodology: In order to compile this list, we have tracked the daily updates from the 34 Public Health Units in Ontario, including the epidemiological details and outbreak reports where they are publicly available. We have searched each facility name to identify whether it is long-term care or a retirement home and to find details about the cases reported in the aggregate numbers by Public Health Units. We have tracked and compiled media reports of outbreaks with details from across Ontario that contain credible source information (for example, they cited the Public Health Unit, long-term care home administration or hospital administration). Local Public Health Units report in different ways with varying levels of detail. Some do not provide breakdowns of staff/patients/residents. Local Public Health Units usually post outbreak reports for public hospitals, long-term care and retirement homes. The provincial-level information from Public Health Ontario does not include retirement homes or other health care and congregate care/living settings. We have tried to capture everything we can about retirement homes and other health care settings in addition to hospitals (public and private) and long-term care homes using the methodology outlined here. We have not been able to catch up on shelters, group homes and all the various congregate care settings. For that we apologize and will try to capture as much as we can going forward. It is not clear why Public Health Ontario’s numbers for the outbreaks in long-term care and public hospitals are lower than ours. We have repeatedly checked ours for accuracy and we have provided information in the most transparent way possible. In addition, Public Health Units are reporting retirement home outbreaks separately and these numbers should be available to Public Health Ontario but Public Health Ontario does not report the aggregate numbers for retirement homes. Given the number of outbreaks in these private for-profit homes, it is important that the spread in them is also tracked and that they are subject to improved public health measures (and the support needed) to protect residents and staff. Overall, we have tracked every individual case and report in the most credible manner possible and have included sources for each report in the footnotes.
[1] Daily Epidemiologic Summary. Public Health Ontario. June 10 2020. https://covid-19.ontario.ca/covid-19-epidemiologic-summaries-public-health-ontarioNote: it is not clear why the case numbers do not add up to the totals. These are Public Health’s numbers.
[2] Daily Epidemiologic Summary. Public Health Ontario. June 9 2020. https://covid-19.ontario.ca/covid-19-epidemiologic-summaries-public-health-ontarioNote: it is not clear why the case numbers do not add up to the totals. These are Public Health’s numbers.
[3] COVID-19 in Ontario: Focus on May 31, 2020 to June 6, 2020. Public Health Ontario. https://covid-19.ontario.ca/covid-19-epidemiologic-summaries-public-health-ontario#weekly
[4] COVID-19 Surveillance Highlights for Ontario. Public Health Ontario. August 25 2020. https://www.publichealthontario.ca/en/data-and-analysis/infectious-disease/covid-19-data-surveillance/covid-19-data-tool
[5] How Ontario is responding to COVID-19. Province of Ontario. August 25 2020. https://www.ontario.ca/page/how-ontario-is-responding-covid-19
A printable version of the full report can be found here.