
REPORT: Tracking the Spread of COVID-19: Large Outbreaks in Health Care Settings Summary & Report: Over Two Thousand Dead in Long-Term Care as We Approach End of Wave 2 – Data updated to March 3
Posted: March 12, 2021
(March 12, 2021)
Analysis: Status of Current Large Health Care Outbreaks
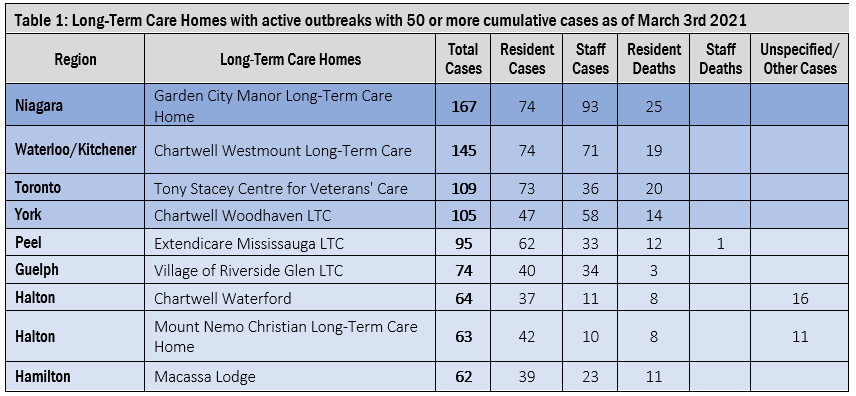
Since our last update February 9 and as measured by the number of large outbreaks in which the spread of COVID-19 has not been limited to less than 10 people, the numbers are de-escalating. The number of large outbreaks has dropped dramatically- we are back down to around the number of large outbreaks as we saw in November. As the devastation of second wave of COVID-19 abates, we are left with 53% more infections and 14% more deaths than the first wave, as well as the certainty that Ontario failed to adequately prepare its health care setting despite months of warning. Details of the nine worst currently-active long-term care outbreaks, with 120 deaths attributed to them, can be found in Table 1 below.
This report shows the growth of the 49 currently active large outbreaks in health care settings. This is a decrease from our report on February 9 in which we found 155 large outbreaks. Of the 49 large active outbreaks (those which include more that 10 residents, patients, and staff) as of March 3, 2021:
- 23 are in long-term care homes
- 17 are in 12 hospitals
- 7 are in retirement homes
- 2 are in other health care settings.
The sizes of these 49 large outbreaks across all health care settings as of March 3 are as follows:
- 49 outbreaks include 10 or more residents and staff infected;
- 10 outbreaks include 50 or more residents and staff infected;
- 4 outbreaks include 100 or more residents and staff infected, and;
- 1 outbreak includes 150 or more residents and staff infected.
By comparison, the large outbreaks across all health care settings as of February 9 were as follows: [1]
- 155 outbreaks include 10 or more residents and staff infected;
- 63 outbreaks include 50 or more residents and staff infected;
- 24 outbreaks include 100 or more residents and staff infected;
- 8 outbreaks include 150 or more residents and staff infected;
- 4 outbreaks include 200 or more residents and staff infected;
- 1 outbreak includes 250 or more residents and staff infected, and;
- 1 outbreak includes 300 or more residents and staff infected.
The number of people infected in active large outbreaks has decreased by every measure. As of March 3, the cumulative number of residents and patients infected just in the currently active large outbreaks in health care settings is 1,106. This is a 78% decrease from our last report, February 9, when the cumulative number of residents/patients infected in the then-active large outbreaks was 5,092. The cumulative number of staff members infected in active large outbreaks is 641, which is an 80% decrease from 3,289 a month on February 9. The number of other cases (including unspecified cases and visitors) is 103, for a total of 1,850 cases cumulative in the currently active large outbreaks. Four weeks earlier, the total number of cases in the then-active large outbreaks was 8,564; thus, there was a 78% decrease in cases in currently active large health care outbreaks overall.
Regardless of the decrease in the number of large outbreaks, almost a third of the long-term care outbreaks that are currently active are large and have not been controlled effectively. Of the 74 active outbreaks in long-term care homes, 23 of them or 31% have more than 10 patients, residents, and staff infected and a number of these outbreaks are still growing.
With great sadness we report that 213 of those residents and patients have died in the currently active large outbreaks. These are huge numbers and they capture only the largest of the currently active outbreaks in health care. These numbers represent human beings and they underline the fact that the measures being taken to improve infection control and care in those facilities are not adequate to stop the spread of the virus. The average number of deaths per currently active large outbreak is 4.3.
Long-term care:
We are seeing the number of active long-term care outbreaks (of all size, including small ones) decrease. The death toll is still tragically high, and we are now seeing the deaths that followed infections by several weeks. The geographic area of large long-term care outbreaks can now be found across the entire breadth of southern Ontario and into northern Ontario.
Growth in the number of people infected in long-term care 2nd wave:
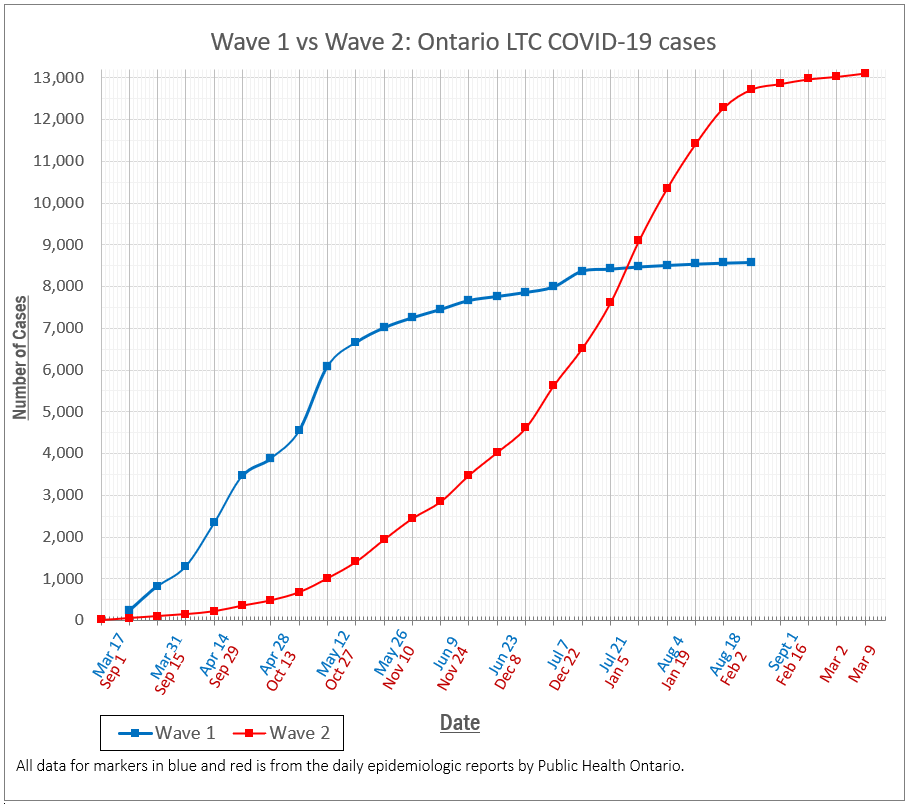
The number of cumulative cases in the second wave has far surpassed the amount from the first wave. Using Public Health Ontario’s daily epidemiologic reports, we have tracked the number of people infected by COVID-19 in long-term care homes since mid-March, and from the beginning of the pandemic to September 1 there had been 8,568 cumulative cases. From September 1 to current day, what we are counting as the second wave, the cumulative number of cases is 13,114 (9,041 residents and 4,052 staff). The total number of long-term care cases in the second wave is 4,546 more than there were in the first wave (March 31 to August 25), or an increase of 53% from that of Wave 1. The total number of long-term care residents and staff deaths in Wave 2 so far is 2,062, which is 13% more than there were in the first wave (1,816).
Since January, there have been 6,204 long-term care residents and staff infected with COVID-19, with 1,078 deaths as of March 9. This averages out to 620 new cases in staff and residents every week of 2021, and 108 deaths each week. The average number of deaths per of the currently active long-term care outbreaks is 6.7.
Trend in the number of active long-term care outbreaks:
- As of March 9 there are 74 active outbreaks in Ontario’s long-term care homes. [2]
- As of February 9 there were 208 active outbreaks in Ontario’s long-term care homes. [3]
- As of January 19 there were 257 active outbreaks in Ontario’s long-term care homes. [4]
- As of January 8 there were 231 active outbreaks in Ontario’s long-term care homes.[5]
- As of December 1 there were 118 active outbreaks in Ontario’s long-term care homes. [6]
- As of November 17 there were 100 active long-term care outbreaks.[7]
- As of October 31 there were 76 active long-term care outbreaks.[8]
- As of September 30 there were 42 active long-term care outbreaks. [9]
- As of September 1 there were 18 active long-term care outbreaks [10]
Growth in the size of the active long-term care outbreaks:
Out of all health care settings, the outbreaks in long-term care remain the largest. The currently active large outbreaks are not as nearly large as the ones from January and February, but still have a significant number of residents and staff infected.
Of the current large Ontario long-term care home outbreaks (as of March 3rd, not counting outbreaks in retirement homes, hospitals, or any other health care setting):
- 23 outbreaks include 10 or more residents and staff infected;
- 9 outbreaks include 50 or more residents and staff infected;
- 4 outbreaks include 100 or more residents and staff infected, and;
- 1 outbreak includes 150 or more residents and staff infected.
By comparison, the large long-term care outbreaks as of February 9th were as follows: [11]
- 102 outbreaks included 10 or more residents and staff infected;
- 52 outbreaks included 50 or more residents and staff infected;
- 23 outbreaks included 100 or more residents and staff infected;
- 8 outbreaks included 150 or more residents and staff infected;
- 4 outbreaks included 200 or more residents and staff infected;
- 1 outbreak included 250 or more residents and staff infected, and;
- 1 outbreak included 300 or more residents and staff infected.
Geographic spread of the outbreaks:
Most of the large long-term care outbreaks in northern Ontario now resolved, such as the outbreak at Southbridge Roseview Manor in Thunder Bay, which had 74 residents and 40 staff infected, and 23 residents died.
Toronto, York, Halton, Hamilton have been consistent hotspots throughout the second wave. Active large long-term care outbreaks can also be found in the following regions: Durham, Eastern Ontario, Guelph, Niagara, Peel, Simcoe Muskoka, and Waterloo/Kitchener.
[1] REPORT: Tracking the Spread of COVID-19: Large Outbreaks in Health Care Settings Summary & Report: Second Wave in Long-Term Care Infections & Deaths have Surpassed First Wave – Data updated to February 9. Ontario Health Coalition. February 17 2021. https://www.ontariohealthcoalition.ca/index.php/report-tracking-the-spread-of-covid-19-large-outbreaks-in-health-care-settings-summary-report-second-wave-in-long-term-care-infections-deaths-have-surpassed-first-wave-data-updated-to-februar/
[2] Daily Epidemiologic Summary- COVID-19 in Ontario: January 15, 2020 to March 9, 2020. Public Health Ontario. March 10 2021. https://files.ontario.ca/moh-covid-19-report-en-2021-03-10_v2.pdf
[3] Daily Epidemiologic Summary- COVID-19 in Ontario: January 15, 2020 to February 9, 2020. Public Health Ontario. February 10 2021. https://files.ontario.ca/moh-covid-19-report-en-2021-02-10_v2.pdf
[4] Daily Epidemiologic Summary- COVID-19 in Ontario: January 15, 2020 to January 19, 2020. Public Health Ontario. January 20 2021. https://files.ontario.ca/moh-covid-19-report-en-2021-01-20_v2.pdf
[5] Daily Epidemiologic Summary- COVID-19 in Ontario: January 15, 2020 to January 8, 2020. Public Health Ontario. January 9 2021. https://files.ontario.ca/moh-covid-19-report-en-2021-01-06.pdf
[6] Daily Epidemiologic Summary- COVID-19 in Ontario: January 15, 2020 to December 1, 2020. Public Health Ontario. December 2 2020. https://files.ontario.ca/moh-covid-19-report-en-2020-12-02.pdf
[7] Daily Epidemiologic Summary- COVID-19 in Ontario: January 15, 2020 to November 17, 2020. Public Health Ontario. November 17 2020. https://files.ontario.ca/moh-covid-19-report-en-2020-12-02.pdf
[8] Daily Epidemiologic Summary- COVID-19 in Ontario: January 15, 2020 to October 31, 2020. Public Health Ontario. October 31 2020. https://files.ontario.ca/moh-covid-19-report-en-2020-12-02.pdf
[9] Daily Epidemiologic Summary- COVID-19 in Ontario: January 15, 2020 to September 30, 2020. Public Health Ontario. September 30 2020. https://files.ontario.ca/moh-covid-19-report-en-2020-12-02.pdf
[10] Daily Epidemiologic Summary- COVID-19 in Ontario: January 15, 2020 to September 1, 2020. Public Health Ontario. September 2 2020. https://files.ontario.ca/moh-covid-19-report-en-2020-12-02.pdf
[11] REPORT: Shocking Number of Long-Term Care Homes with Majority of Residents Infected – Data updated to January 19. Ontario Health Coalition. January 22 2021. https://www.ontariohealthcoalition.ca/index.php/report-shocking-number-of-long-term-care-homes-with-majority-of-residents-infected/
