
REPORT: Wave 2 Continues to Devastate Long-Term Care, Far Surpassing the 1st Wave – Data updated to January 19
Posted: January 22, 2021
(January 22, 2021)
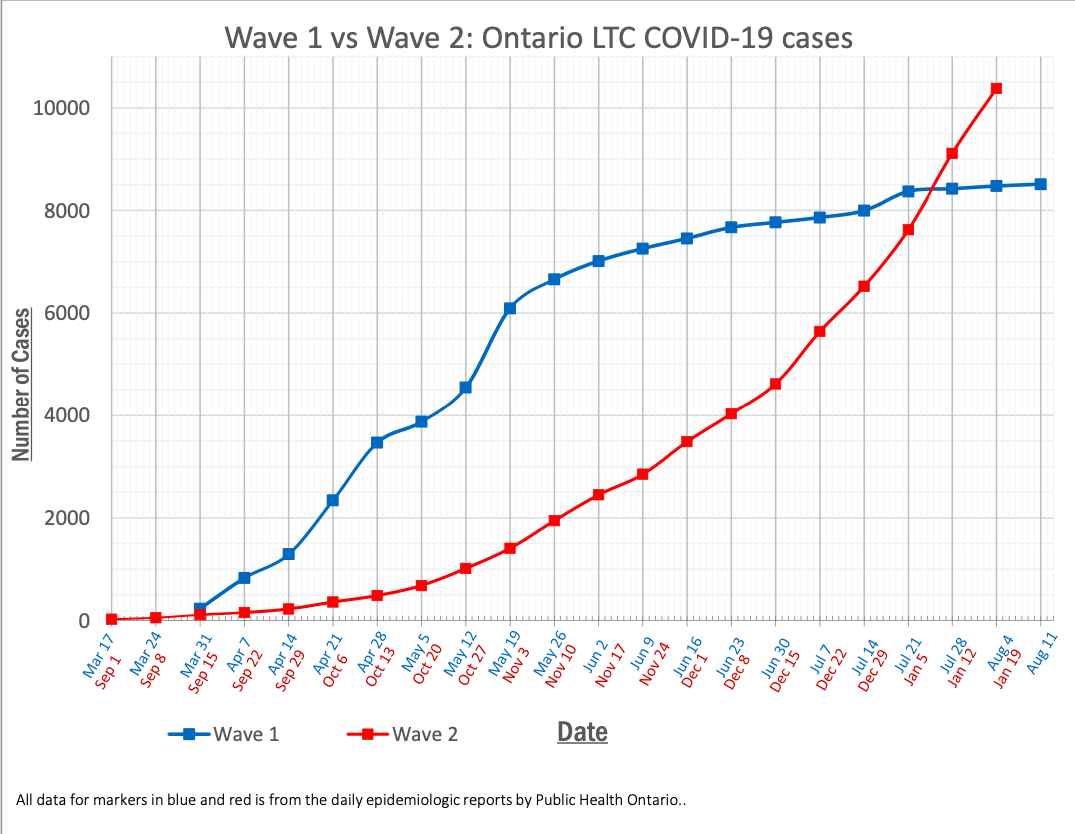
The second wave of COVID-19 in Ontario’s long-term care homes has now far exceeded the number of cases that were seen in the first wave. The beginning of July is widely recognized as the end of the first wave.
- March to July Wave I total long-term care COVID-19 cases: 7,768
- September to January 19 Wave II total long-term care COVID-19 cases: 10, 379
From the beginning of September and present-day, Ontario has suffered 2,607 more COVID-19 cases in long-term care than we had seen between March to July. Starting from mid-December we have seen an escalation by about a thousand cases every week. By early January that escalated to 1,260 to more than 1,500 cases per week and there is no sign of the spread of virus slowing down.
Clearly the measures that have been taken are not adequate. Virtually every day we hear from staff and families about inadequate PPE, inadequate cohorting and infection control practices, lack of accountability for the home operators who are not ensuring adequate safety measures, and crisis-level staffing shortages.
The following report tracks and analyses at the large outbreaks in long-term care, retirement homes and hospitals across Ontario currently.
Analysis: Status of Current Large Health Care Outbreaks
By every measure, the large outbreaks in health care settings (hospitals, long-term care, retirement homes) in which the spread of COVID-19 has not been limited to less than 10 people, the rate of spread of the virus is frightening:
- The number of large outbreaks has increased drastically.
- The size of the large outbreaks has also increased significantly.
- The geographic area in which there are large outbreaks continues to increase.
Total currently active health care outbreaks (long-term care, retirement homes and hospitals) is 520 including all large outbreaks and outbreaks that are currently small. [1]
- Total current long-term care outbreaks: 257[2], of which 99 are large outbreaks (>10 residents and/or staff infected).
- Total current hospital outbreaks: 92[3], of which 36 from 19 hospitals are large outbreaks.
- Total current retirement home outbreaks: 171[4], of which 39 are large outbreaks.
This report shows the growth of the 177 current large outbreaks in health care settings. In the short time period of 11 days, the number of large outbreaks has increased by 33% since our report on January 8 where we found 133 large outbreaks. Of the 177 large active outbreaks (those which include more that 10 residents, patients, and staff) as of January 19, 2021:
- 99 are in long-term care homes
- 36 are in 19 hospitals
- 39 are in retirement homes.
The Minister of Long-Term Care has repeatedly tried to downplay the situation but looking at the numbers we are finding, just in the large outbreaks, we can see that there is no question that the outbreaks which have not been controlled at very small numbers have grown alarmingly and the number of people — both residents and staff affected — has also increased in a devastating way. As of January 19, the cumulative number of residents and patients infected just in the currently active large outbreaks in health care settings is 5,750. This is a 35% increase from our last report, January 8, when the cumulative number of residents/patients infected in active large outbreaks was 4,256. The cumulative number of staff members infected in active large outbreaks is 3,850, which is an 32% increase from 2,918 less than two weeks ago on January 8. This includes recent outbreaks among Hamilton paramedics and Niagara EMS workers (see details in report below). The number of other cases (including unspecified cases and visitors) is 179, for a total of 9,779 cases cumulative in the currently active large outbreaks. Eleven days earlier, the total number of cases in currently active large outbreaks was 7,385; thus, there was a 32% increase in cases in large long-term care outbreaks overall.
With great sadness we report that 1,035 of those residents and patients have died in just the large outbreaks. These are huge numbers and they capture only the currently active large outbreaks in health care. These numbers represent human beings and they underline the fact that the measures being taken to improve infection control and care in those facilities are not adequate to stop the spread of the virus.
Long-term care:
Through the summer months following the first wave of the pandemic, though long-term care outbreaks still began, there was only one that had more than five cases. After September 1 and particularly after schools reopened, case numbers in long-term care began to rise. The beginning of September now clearly delineates the start of the second wave. On August 30, the second wave began with the outbreak at Extendicare’s West End Villa in Ottawa. Within a few weeks 11 Ottawa long-term care homes were in outbreak followed by the beginning of large outbreaks in Halton, Niagara and Toronto. Over the winter holidays the case numbers in long-term care sky-rocketed. Over the last four and a half months both the number of the outbreaks and the severity of the outbreaks has increased dramatically. The death toll is increasing tragically, as deaths follow infections by several weeks. Long-term care outbreaks have spread now across the entire breadth of southern Ontario and into northern Ontario.
Growth in the number of people infected in long-term care 2nd wave:
The numbers of people infected in long-term care are continuing to increase at an alarming rate. At the end of August there were there were 3 currently active cases among long-term care residents and 18 currently active cases among long-term care staff.[5] Using Public Health Ontario’s daily epidemiologic reports we have tracked the number of people infected by COVID-19 in long-term care homes in the second wave of COVID-19 (since September 1). From September 1 to November 17 the cumulative number had increased by 2,424 (1,920 residents and 504 staff). From November 17 to December 1 the cumulative number increased to 3,462 (2,737 residents and 725 staff), and from December 1 to January 8 the cumulative number increased to 7,971 (5,978 residents and 1,993 staff). From January 8 to January 19, the cumulative number has increased to 10,339 (7,612 residents and 2,727 staff). By Public Health Ontario’s measures, the total number of long-term care cases has increased by 30% in 11 days.
Growth in the number of active long-term care outbreaks:
- As of January 19 there are 257 active outbreaks in Ontario’s long-term care homes. [6]
- As of January 8 there were 231 active outbreaks in Ontario’s long-term care homes.[7]
- As of December 1 there were 118 active outbreaks in Ontario’s long-term care homes. [8]
- As of November 17 there were 100 active long-term care outbreaks.[9]
- As of October 31 there were 76 active long-term care outbreaks.[10]
- As of September 30 there were 42 active long-term care outbreaks. [11]
- As of September 1 there were 18 active long-term care outbreaks [12]
Growth in the size of the active long-term care outbreaks:
There continue to be more large outbreaks each period of several weeks that we measure, and the severity of those outbreaks is continuing to increase as shown in the numbers below. Three of the currently active large long-term care outbreaks are at homes that have already had another, now resolved, large outbreak earlier in the second wave.
Of the current large Ontario long-term care home outbreaks (January 19)
- 99 outbreaks include 10 or more residents and staff infected;
- 53 outbreaks include 50 or more residents and staff infected;
- 29 outbreaks include 100 or more residents and staff infected;
- 15 outbreaks include 150 or more residents and staff infected;
- 7 outbreaks include 200 or more residents and staff infected;
- 3 outbreaks include 250 or more residents and staff infected, and;
- 1 outbreak includes 300 or more residents and staff infected.
By comparison, the large long-term care outbreaks as at January 8 were as follows: [13]
- 81 outbreaks include 10 or more residents and staff infected;
- 41 outbreaks include 50 or more residents and staff infected;
- 19 outbreaks include 100 or more residents and staff infected;
- 11 outbreaks include 150 or more residents and staff infected;
- 7 outbreaks include 200 or more residents and staff infected, and;
- 3 outbreaks include 250 or more residents and staff infected.
Geographic spread of the outbreaks:
All but 2 of the long-term care outbreaks in Ottawa, where the second wave began, are now resolved. Barrie has a devastating large outbreak that is now confirmed to include the U.K. variant of COVID-19. London is now seeing large outbreaks, as are the regions of Guelph (listed under Wellington/Dufferin/Guelph in this report) and Waterloo. Toronto, Halton, Hamilton, and Peel have been consistent hotspots throughout the second wave. Niagara, Windsor, and Eastern Ontario are seeing many new large outbreaks in the last 2 weeks. Northern regions such as the district of Thunder Bay were nearly untouched by COVID-19 in the first wave, but started seeing large outbreaks at the end of November, along with Durham which is once again growing into a “hotspot”. Haliburton has had its first large outbreak of the second wave start recently.
Hospitals:
A large number of large COVID-19 outbreaks in the second wave have occurred in hospitals. On January 8, we had found 10 hospitals that had 20 active outbreaks among them (if the number of cumulative cases from all outbreaks occurring at the same hospital equal ten or more, then we count that hospital in the large outbreaks tracking).[14] As of January 19, we have found 19 hospitals with 36 large active outbreaks. 11 of these hospitals are within the Toronto Public Health unit.
[1] Daily Epidemiologic Summary- COVID-19 in Ontario: January 15, 2020 to January 19, 2020. Public Health Ontario. January 20 2021. https://files.ontario.ca/moh-covid-19-report-en-2021-01-20_v2.pdf
[2] Daily Epidemiologic Summary- COVID-19 in Ontario: January 15, 2020 to January 19, 2020. Public Health Ontario. January 20 2021. https://files.ontario.ca/moh-covid-19-report-en-2021-01-20_v2.pdf
[3] Daily Epidemiologic Summary- COVID-19 in Ontario: January 15, 2020 to January 19, 2020. Public Health Ontario. January 20 2021. https://files.ontario.ca/moh-covid-19-report-en-2021-01-20_v2.pdf
[4] Daily Epidemiologic Summary- COVID-19 in Ontario: January 15, 2020 to January 19, 2020. Public Health Ontario. January 20 2021. https://files.ontario.ca/moh-covid-19-report-en-2021-01-20_v2.pdf
[5] Ibid accessed August 24, 2020.
[6] Daily Epidemiologic Summary- COVID-19 in Ontario: January 15, 2020 to January 19, 2020. Public Health Ontario. January 20 2021. https://files.ontario.ca/moh-covid-19-report-en-2021-01-20_v2.pdf
[7] Daily Epidemiologic Summary- COVID-19 in Ontario: January 15, 2020 to January 8, 2020. Public Health Ontario. January 9 2021. https://files.ontario.ca/moh-covid-19-report-en-2021-01-06.pdf
[8] Daily Epidemiologic Summary- COVID-19 in Ontario: January 15, 2020 to December 1, 2020. Public Health Ontario. December 2 2020. https://files.ontario.ca/moh-covid-19-report-en-2020-12-02.pdf
[9] Daily Epidemiologic Summary- COVID-19 in Ontario: January 15, 2020 to November 17, 2020. Public Health Ontario. November 17 2020. https://files.ontario.ca/moh-covid-19-report-en-2020-12-02.pdf
[10] Daily Epidemiologic Summary- COVID-19 in Ontario: January 15, 2020 to October 31, 2020. Public Health Ontario. October 31 2020. https://files.ontario.ca/moh-covid-19-report-en-2020-12-02.pdf
[11] Daily Epidemiologic Summary- COVID-19 in Ontario: January 15, 2020 to September 30, 2020. Public Health Ontario. September 30 2020. https://files.ontario.ca/moh-covid-19-report-en-2020-12-02.pdf
[12] Daily Epidemiologic Summary- COVID-19 in Ontario: January 15, 2020 to September 1, 2020. Public Health Ontario. September 2 2020. https://files.ontario.ca/moh-covid-19-report-en-2020-12-02.pdf
[13] REPORT: Tracking the Spread of COVID-19: COVID Numbers in Health Care Outbreaks Escalating Dramatically – Data Updated to January 8 Ontario Health Coalition. November 19 2020. https://www.ontariohealthcoalition.ca/index.php/report-tracking-the-spread-of-covid-19-rise-in-large-covid-19-outbreaks-in-health-settings/
[14] REPORT: Tracking the Spread of COVID-19: COVID Numbers in Health Care Outbreaks Escalating Dramatically – Data Updated to November 17. Ontario Health Coalition. November 19 2020. https://www.ontariohealthcoalition.ca/index.php/report-tracking-the-spread-of-covid-19-covid-numbers-in-health-care-outbreaks-escalating-dramatically-data-updated-to-november-17/
